Fix It on Screen, Not on Site
Green Building Design
How we use energy simulation to design for comfort, efficiency, and green building performance before construction begins.
The most important decisions about how a building will perform are made long before anyone pours concrete. Which way it faces. How its walls and glass handle heat. Where the sun falls through the day, and how much daylight reaches the rooms. Once the structure is standing, these things are fixed. You can swap a light fitting later, but you cannot easily turn a building around or rebuild its walls.
That is the idea behind everything we do with energy simulation. We build the whole building first as a digital model, run it through a full year of the local climate, and study how it behaves before it exists in brick and concrete. A problem that would be slow and costly to fix on site is easy to fix on screen, while it is still just a few lines on a drawing.
Why we model before we build
A green building is not green because of one clever feature. It earns that name because dozens of choices, the orientation, the envelope, the glazing, the shading, the lighting, the cooling system, the rooftop solar, all pull in the same direction. Get them working together and the building stays comfortable while drawing far less energy. Let them work against each other and even a well meaning design quietly wastes power for its entire life.
Simulation lets us watch those choices interact before they are locked in. Instead of guessing, we test. Instead of discovering a problem after handover, we catch it at the drawing board, where a change costs nothing more than a few hours of work.
What the model lets us study
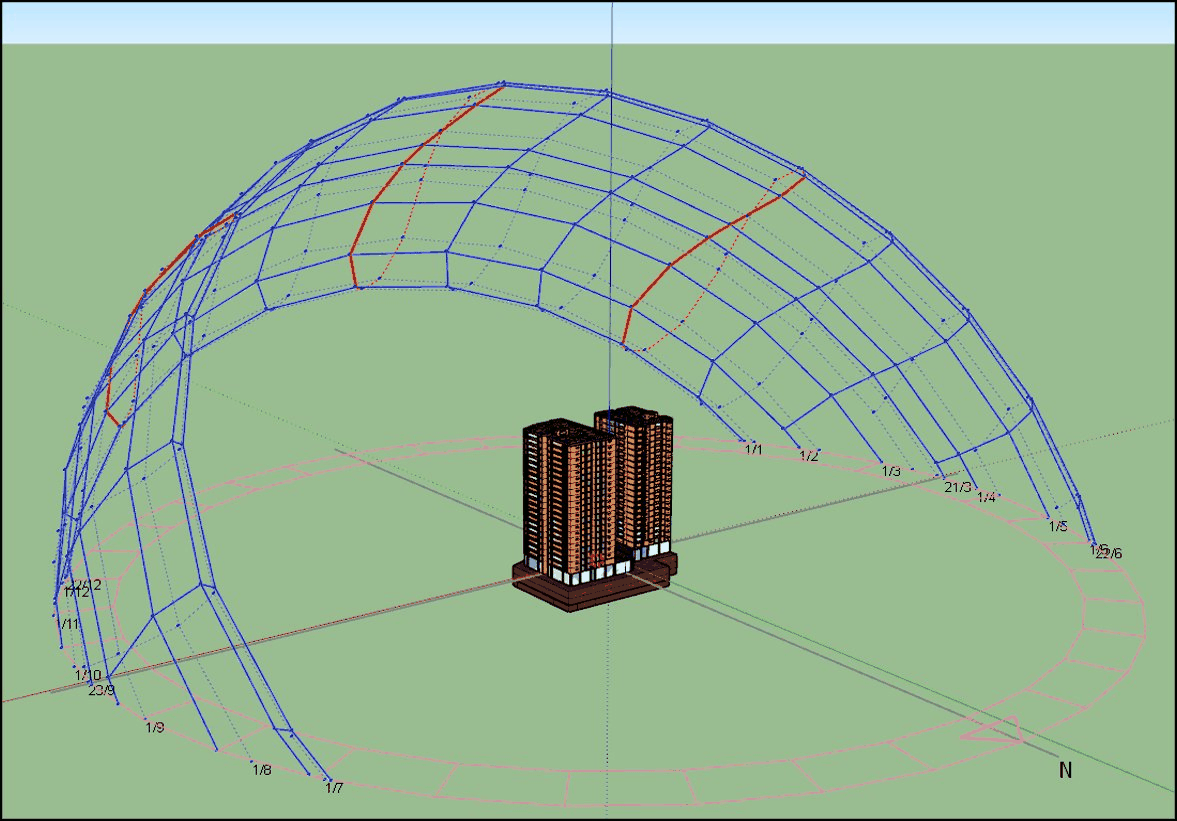
We build the building's three dimensional geometry and bring it into a whole building energy engine, where every surface, material, and system is described in detail. The model then runs through a full year using weather data for the project's own location, so the results reflect the real climate the building will have to live in.
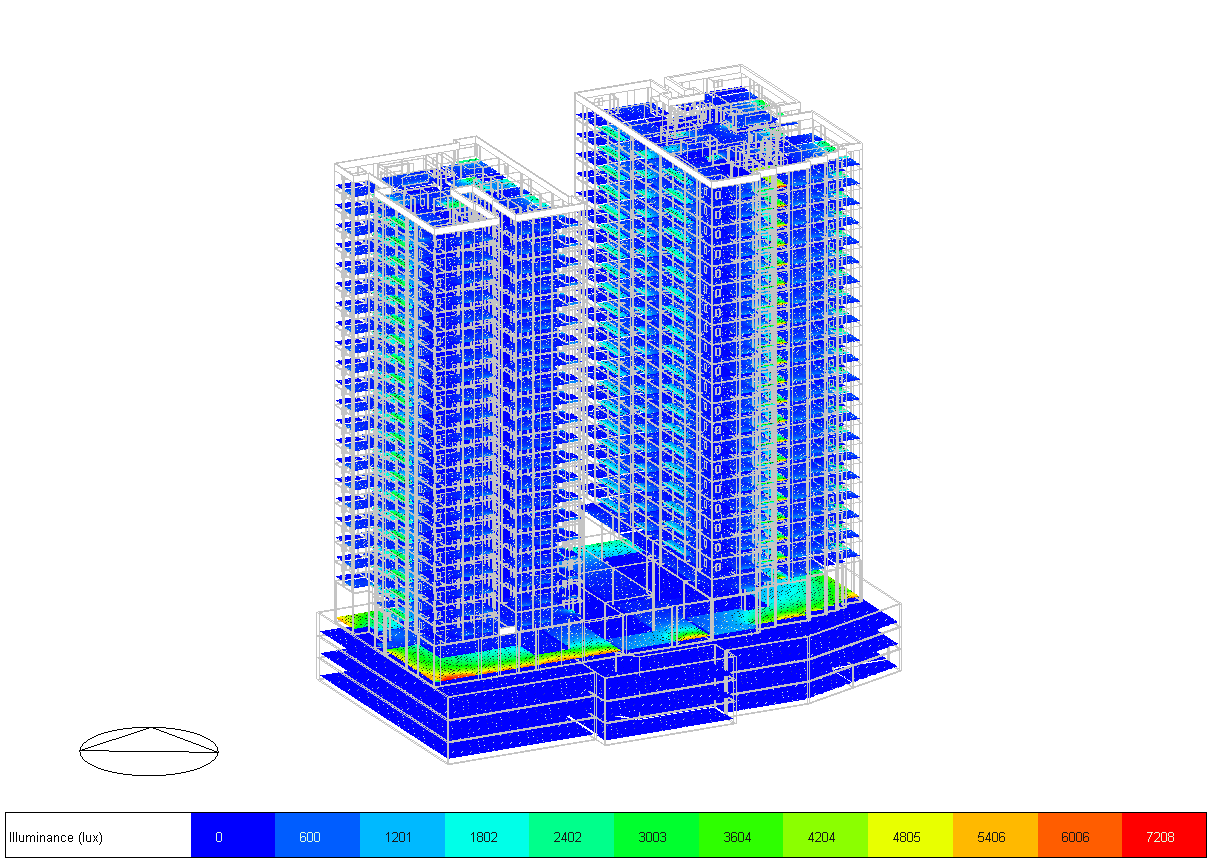
Inside that one model we look at the design from many angles at once. We test how the building's orientation changes the heat it collects through the day, and how the envelope, the walls, roof, and glazing, slows that heat from reaching the rooms. We check how shading from balconies and projections keeps direct sun off the glass, and how much daylight reaches the interior so that spaces feel bright without the discomfort of glare. We look at how efficient the lighting is and how much power it draws, and we follow how hard the cooling system has to work to hold each space comfortable through the hottest months. Because all of this sits in a single model, we see how the choices affect one another, as one connected picture rather than a set of separate guesses.
Here is what part of that work looks like on a real project, a pair of residential towers we studied through the same kind of model.
Two buildings, one comparison
Green building rating systems judge a design by setting it against a reference, or baseline, version of the same building. So we build two models. The first is the baseline, fixed to the standard construction and systems the rating system defines. The second is the proposed design, carrying the actual measures we are recommending, better glazing, a stronger envelope, efficient lighting, and rooftop solar.
To keep the comparison honest, we do not lean on a single orientation. We rotate the baseline through the main compass directions and average the results, so no lucky or unlucky facing skews the benchmark, then run the proposed design at the building's true orientation on site. We also divide the building into zones, basement, common areas, homes, rooftop, each with its own pattern of use, so the model reflects how the building is actually lived in instead of treating it as one plain box.
Two simple measures carry most of the story. The first is the Energy Performance Index, which expresses a building's yearly energy use for every square metre of floor area, so buildings of any size can be compared on fair terms.
EPI = ( annual energy use ) — ( built up area ) measured in kWh for each square metre per year — lets buildings of different sizes be compared fairly
The second is the saving itself, the percentage by which the proposed design improves on the baseline.
saving = ( baseline - proposed ) — baseline — 100 the share of energy the design removes relative to the reference building
A lower index and a higher saving both point the same way, toward a building that costs less to run and sits lighter on the grid.
From results to decisions
A simulation only earns its place if it changes what gets built, so we never stop at the numbers. We read the results to find where the energy is going, almost always cooling first, then lighting, and trace each load back to a design choice we can improve. If cooling runs high, we revisit the glazing, the shading, and the insulation. If lighting is heavy, we look again at fixture efficiency and at how much daylight the rooms can use. If the rooftop has room to spare, we size the solar to match. Each pass through the model turns a finding into a clear, practical recommendation the design team can act on.
Where AI and data come in
Careful simulation has always taken time. What has changed is how we get there. We now use AI assisted workflows and data driven methods to make the modelling both faster and more accurate. They help us pull dimensions and areas straight from drawings with fewer manual slips, set up and organise the model more quickly, and run far more design variations than was once practical, testing different glazing, orientations, and shading options side by side. They also help us cross check the inputs and the results, so little is left to chance. The gain is not only speed. By clearing away the slow, repetitive work, these tools free us to spend more of our time on the part that truly matters, the design judgment behind the numbers.
How a study comes together
Model
Build the geometry in 3D
Climate
Load the local weather
Design
Envelope, lighting, systems, solar
Run
Baseline against proposed
Read
Energy, comfort, EPI
Decide
Turn results into design moves
Why this matters for the people we work with
For a developer, an architect, or a certification body, the value of designing this way comes down to four things.
Efficiency
Two to three weeks of preparation comes down to a single day, once the documents and data are in.
Comfort
Spaces are checked for heat, daylight, and glare before they are built, so the building feels good to be in, not just efficient on paper.
Compliance
The analysis produces the evidence green building rating systems ask for, supporting the credits and certification the project is aiming at.
Certainty
Decisions are tested while they can still be changed cheaply, so there are far fewer costly surprises once construction begins.
Settled at the drawing board
You cannot retrofit good design into a finished building, at least not easily or cheaply. The cooling bills, the comfort, the carbon, much of it is settled the day the drawings are frozen. Energy simulation is simply how we make sure those drawings are right. We put the building through a full year of weather, study how each part shapes the rest, and hand the design team clear, practical ways to do better, all before the first wall goes up.
Planning a green building and want its performance proven at the design stage rather than hoped for afterwards? We would be glad to talk it through with you.